The effect of Ozonated Saline Solutions on tumours
Effectiveness of ozonated saline in the treatment of VX2 tumours in rabbits
Journal of Interventional Medicine

Keywords: Ozone, neoplasm, VX2 tumour, therapy, effectiveness, Ozonated Saline Solutions
Abstract
Objective: “To investigate the efficacy, safety, and associated mechanisms of injected ozonated saline in the treatment of VX2 tumors.” (1) (Ozonated Saline Solutions)
Method: “A total of 90 rabbits bearing VX2 tumors on their left hind legs were randomly divided into three groups. The control group (A) received normal saline, while groups B and C received 20 μg/mL and 40 μg/mL O3/O2 ozonated saline, respectively. Several milliliters of saline, saline pre-treated with 20 μg/mL O3/O2, or saline pre-treated with 40 μg/mL O3/O2 were directly injected into the tumors of groups A, B, and C, respectively (injection volume (milliliter) =1/2 volume of the tumor, V = 1/2ab2). On days 4, 8 and 12 following treatment, 10 rabbits were randomly selected from each group for blood sample collection, and serum IL-6 and TNF-α were measured. The tumor growth rate was calculated by measuring the maximum and vertical diameters of the VX2 tumors under direct visualization. All selected rabbits were euthanized and the tumors, livers, and lungs were removed for pathological examination. The tumor necrosis rate was calculated by cutting the tumors into half along the longitudinal axis and measuring the maximum diameters of the intratumoural necrotic regions.” (1)
Results: “The average tumor volume in the three groups increased to different degrees at each time point; however, the average tumor growth rates in groups B and C were substantially lower than that in group A, exhibiting a statistically significant difference. The difference in the tumor growth rate between group B and group C was not statistically significant. The serum concentrations of IL-6 and TNF-α increased in the three groups at each time point, with larger increases occurring in groups B and C; however, the greater increases did not reach statistical significance. Although the diameters of the necrotic areas were larger in both groups B and C than that in group A, significant differences in necrotic area diameters were only found when comparing groups A and C on days 4 and 12 following treatment.”(1)
Ozonated Saline Solutions
Conclusion: “Direct injection of different concentrations of ozonated saline into VX2 tumors significantly increased intratumoral necrosis and reduced the tumor growth rate.”(1)
Experimental Data
Table 1, Figure 1, Table 2, Figure 2, Table 3, Figure 3, Table 4, Figure 4
Table 1 demonstrates the tumor growth rates in the three groups of animals. Significant differences in tumor growth rates were found at different time points between the experimental groups and the control group (P = 0.000 at day 4; P = 0.012 at day 8; and P = 0.004 at day 12). No significant difference in tumor growth rate was found between the two experimental groups (Groups B and C; P > 0.05). On day 4, two tumors in group B and four tumors in group C had shrunk obviously, while the tumor volumes in group A were larger. On day 8, only one tumor (different from the ones that had shrunk before) in group C had shrunk, while the remaining tumors including the ones that originally shrunk in group C were enlarged. On day 12, all tumors including the ones that originally shrunk in the three groups were enlarged.

Changes of TGR As shown in Figure 1, the overall changes in tumor growth rate increased in all three groups during the experiment. The most obvious increase was observed in group A on days 8 and 12. The tumor growth rates in Groups B and C were similar on day 0–8, with the tumor volume growth rate in group C slightly higher than in group B on days 8–12.
Internal tumor necrosis rate
Table 2 shows the tumor necrosis rates in the different groups. The internal necrosis rates in groups B and C on days 4 and 12 were higher than in group A. The difference was statistically significant between group C and group A (P < 0.05); however, the differences were not statistically significant where comparing group C to group B or group A to group B (P > 0.05). The internal necrosis rates in groups B and C were higher on day 8 than in group A. However, there were no statistically significant differences in internal necrosis rates between the all groups on day 8 (P > 0.05).

As shown in Figure 2, the internal necrosis rate of the tumors in group A (control group) demonstrated a linear increase; however, it was significantly lower compared with the two experimental groups B and C.
Changes in IL-6 concentration
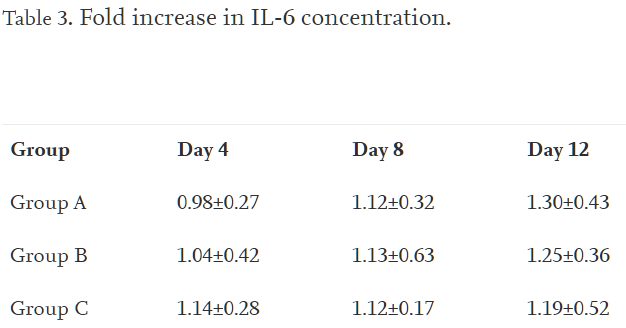
As shown in Table 3, the fold increase in IL-6 levels among the three groups at different time points was not statistically different (P > 0.05). On day 4, the increases in IL-6 concentration in the experimental groups were obviously higher than in the control group but there were no statistical significance. In addition, the IL-6 concentration in group C was slightly higher than in group B. On day 8, the increase in IL-6 concentration was similar among the three groups, while on day 12, the fold increase in IL-6 in group A was slightly higher than in groups B and C.
Figure 3 demonstrates the overall variation in fold increase in IL-6 levels during the experiment. The fold increases in IL-6 were linear in groups A and B, while the fold increase in IL-6 was slightly reduced on days 5–8 but elevated in days 9–12 in group C. The fold increase in IL-6 was optimized in group C on day 4, and the fold increase in IL-6 was lowest in Group A on day 4. The fold increase in IL-6 was similar in all groups on day 8, while the fold increase in IL-6 was the lowest in group C and the highest in group A on day 12.
Changes in TNF-α concentration
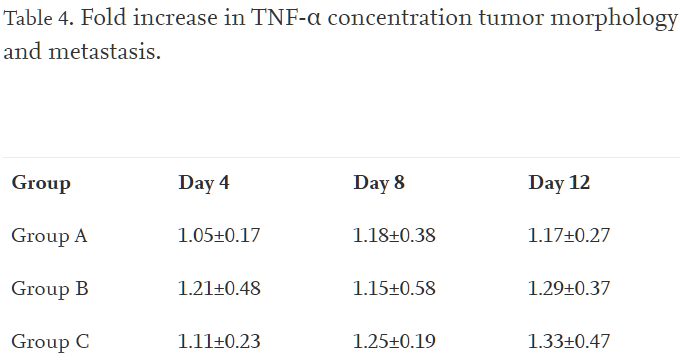
Table 4 shows the fold change in TNF-α concentration in the three groups. No significant differences in TNF-α concentration were found at the different time points among the three groups (P > 0.05). The fold increase in the TNF-α concentration was higher in the experimental groups (groups B and C) than in the control group (group A) on days 4 and 12.

Figure 4 demonstrates the variation in the TNF-α concentration fold increase, showing increases in both groups A and C at different time points, but a slight decrease in group B on days 5–8, which was even lower than the control group (group A) and reversed (increased again) on days 9–12.
Read more for Discussion and References
Source
- (1) https://www.sciencedirect.com/science/article/pii/S2096360219300365 Journal of Interventional Medicine- Qing Ma, Chaoai Yang, Xu Jiang, Jingyu Liu, Yixiang Shi, Hui Li, Hang Liu, Jijin Yang, Volume 1, Issue 3, 2018, Pages 143-149
- Interventional Department, Changhai Hospital, Second Military Medical University, Shanghai 200433, China


